Poor performance is one of the most common criticisms people make about WordPress. There is an old “wooden bucket” analogy that says a bucket can only hold as much water as its shortest board allows. If we want the bucket to hold more water, the first step is finding the shortest board. WordPress optimization works the same way: before we can improve performance meaningfully, we need to know which part of the application is actually slowing everything down.
The challenge is that all of this code runs on the server, and WordPress includes a huge number of functions and classes. That is exactly where XHProf becomes useful. XHProf is a PHP profiling extension originally developed by Facebook. It tracks how code runs so we can see where time is being spent.
Install the XHProf extension
First download XHProf from PECL, extract it, switch into the extension directory, and run commands like the following to compile and install it.
cd xhprof/extension
/usr/local/php5.6/bin/phpize
./configure --with-php-config=/usr/local/php5.6/bin/php-config --enable-xhprof
make
make install
Enable XHProf in WordPress
Then edit php.ini and add a configuration like the following. In this example, xhprof.output_dir is set to /tmp, which is where the generated profile files will be stored.
[xhprof]
extension=xhprof.so
xhprof.output_dir=/tmp
After XHProf generates profiling data, the raw result is only an array, which is not very convenient to inspect directly. XHProf also includes a web-based interface that makes the results easier to review. Place the xhprofhtml and xhproflib directories from the XHProf package inside a web-accessible directory on the server, then open xhprof_html/index.php in the browser.
The report mainly exposes metrics such as the following:
function name: the function name.calls: the number of calls.Incl. Wall Time (microsec): execution time including child functions.IWall%: the share of total time including child functions.Excl. Wall Time (microsec): execution time excluding child functions.EWall%: the share of total time excluding child functions.
If graphviz is installed on the server, XHProf can also generate a graph view like the one below.
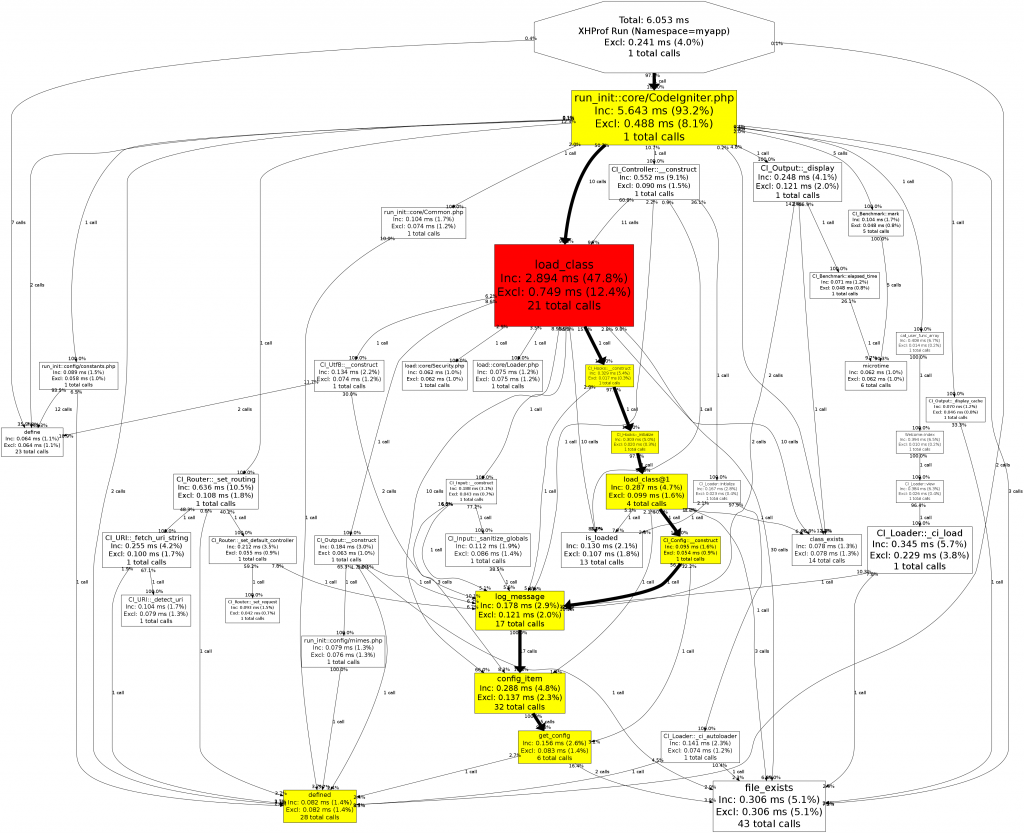
Analyze XHProf results to find the bottlenecks
When looking at WordPress profiling results, a few patterns show up very quickly.
- The biggest performance problems usually come from a relatively small number of functions.
- Database reads are often the largest factor in poor performance, which is why so many WordPress caching plugins focus on reducing database work.
- Metadata handling can have a significant performance impact.
apply_filters()can also account for a meaningful portion of total execution time.
Those observations are useful when designing custom functionality. If possible, reduce unnecessary metadata usage, and if metadata is required, consider combining related values into a single record instead of scattering them across many rows. On larger sites, using a caching plugin is still one of the most effective ways to improve WordPress performance.