Poor performance is a widely criticized feature of WordPress. There is a bucket theory that says how much water a bucket can hold depends on its shortest board. If you want the bucket to hold more water, finding the shortest board is the first step to make the bucket hold more water. Taking WordPress as an example, finding the program processing links that affect the overall performance of WordPress is:Improve WordPress performancethe first step. The problem is that programs are all run on the server. WordPress has so many functions and classes. How can we know which program affects WordPress performance? This is the XHProf I want to introduce to you today. XHProf is an extension developed by Facebook to test PHP performance and is used to track the running status of the program.
Install the XHProf extension
First download XHProf (http://pecl.php.net/package/xhprof) and decompress it, then switch to the decompressed extension directory and install it according to the following command.
cd xhprof/extension
/usr/local/php5.6/bin/phpize
./configure --with-php-config=/usr/local/php5.6/bin/php-config --enable-xhprof
make
make install
Enable XHProf in WordPress
Edit php.ini and add the following configuration, where xhprof.output_dir specifies the location where the generated profile file is stored. We specify it as /tmp.
[xhprof]
extension=xhprof.so
xhprof.output_dir=/tmp
After using XHProf to complete performance analysis and obtain the results, the results are stored in the form of arrays. It is difficult for us to analyze the data without the use of some tools. xhprof provides a web-based interface to facilitate us to view the analysis results. Place the xhprofhtml and xhproflib directories in the XHProf installation package into the server’s Web directory to make the contents of the xhprof_html directory accessible to the outside world. Then visitxhprof_html/index.phpYou can view the analysis results in a visual way. The results mainly include the following data.
- funciton name: function name
- calls: number of calls
- Incl. Wall Time (microsec): Function running time (including sub-functions)
- IWall%: proportion of function running time (including sub-functions)
- Excl. Wall Time(microsec): function running time (excluding sub-functions)
- EWall%: function running time (excluding sub-functions)
If graphviz is installed on the server, we can also get a graph analysis result similar to the following.
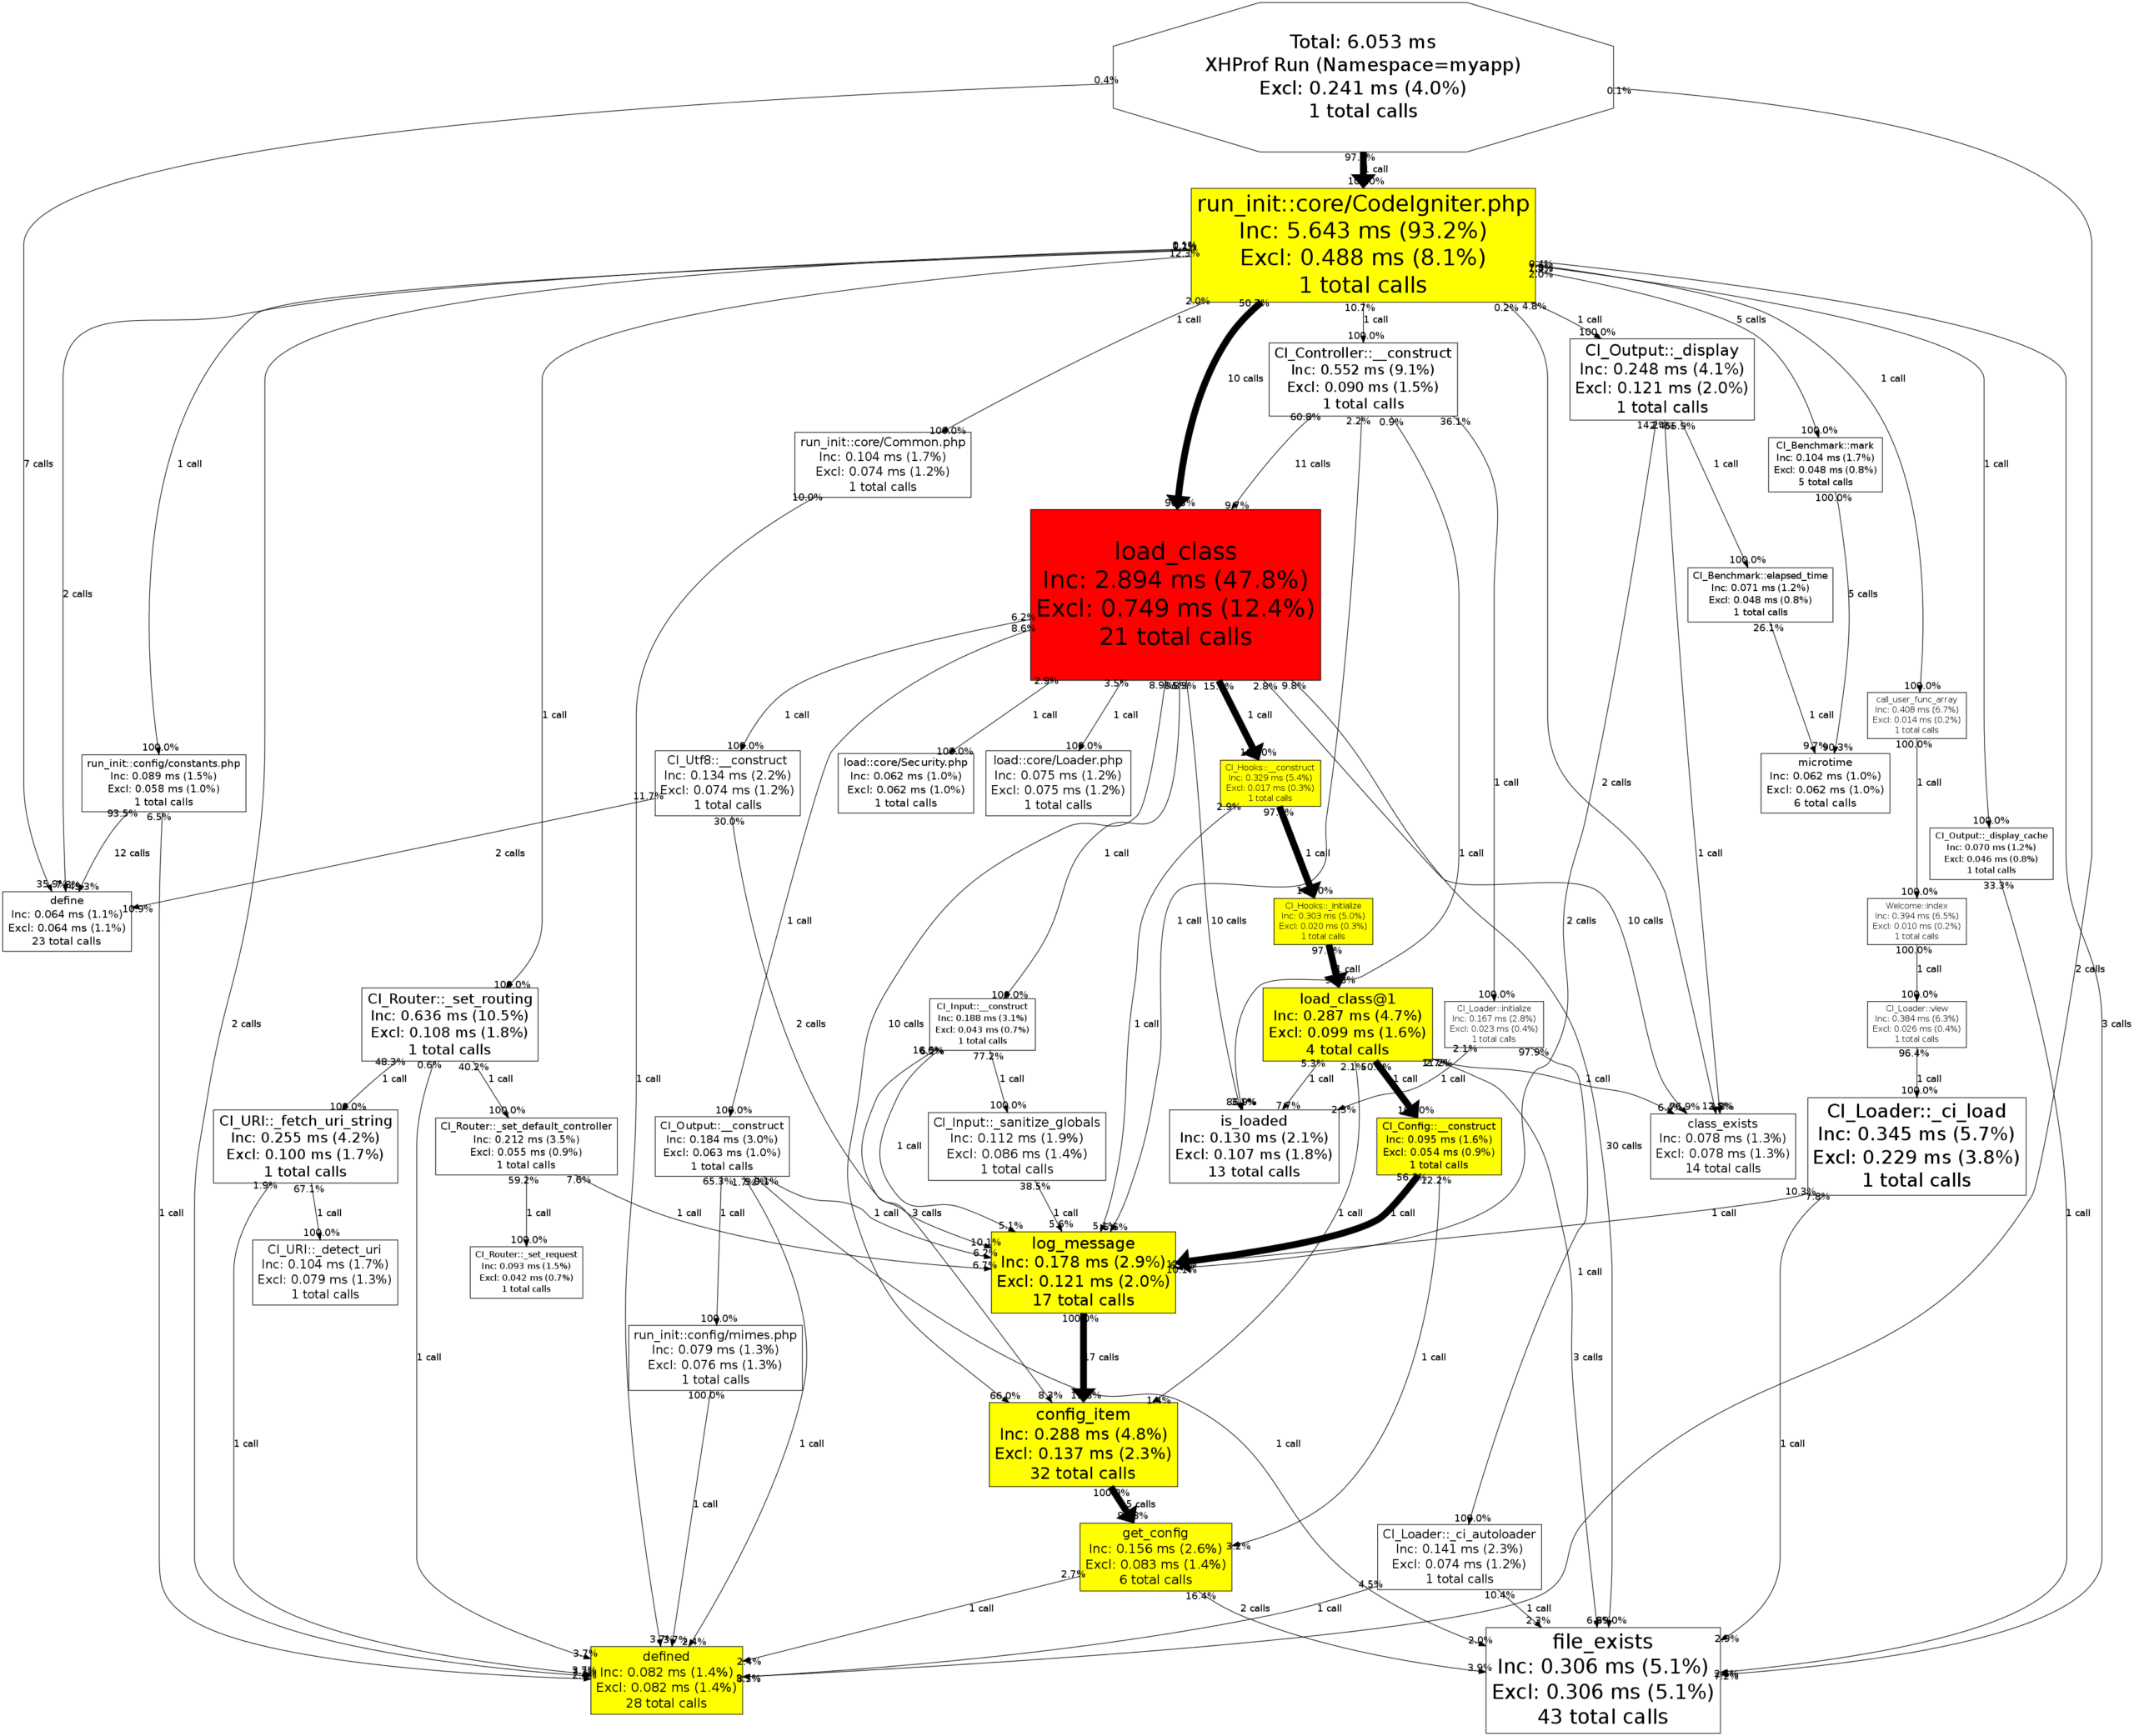
Analyze XHProf data to identify performance bottlenecks
Analyzing the results of WordPress, we can easily draw the following conclusions.
- There are often a few functions that seriously affect WordPress performance.
- Database reads are the biggest factor affecting WordPress performance, which is why most WordPress caching plugins cache data to reduce database reads.
- WordPress’ Metadata has a greater impact on performance.
- apply_filter also has a relatively large impact on performance.
From this, we can get some inspiration. When developing WordPress custom functions, try to reduce the use of Metadata. If you must use it, you can consider combining multiple pieces of data into an array or object and placing them in a Metadata record. At the same time, for websites with large traffic, using caching plug-ins is helpful to improve WordPress performance.